Real Time Temperature Plotting with Raspberry Pi and Plot.ly
- Materials needed:
- Raspberry Pi3
- Connecting pins
- 1KΩresistor (17 pieces)
- 10K pot
- 0.1µF capacitor
- 100µF capacitor
- ADC0804 IC
- LM35 Temperature Sensor
- Bread Board
- Circuit Connections:
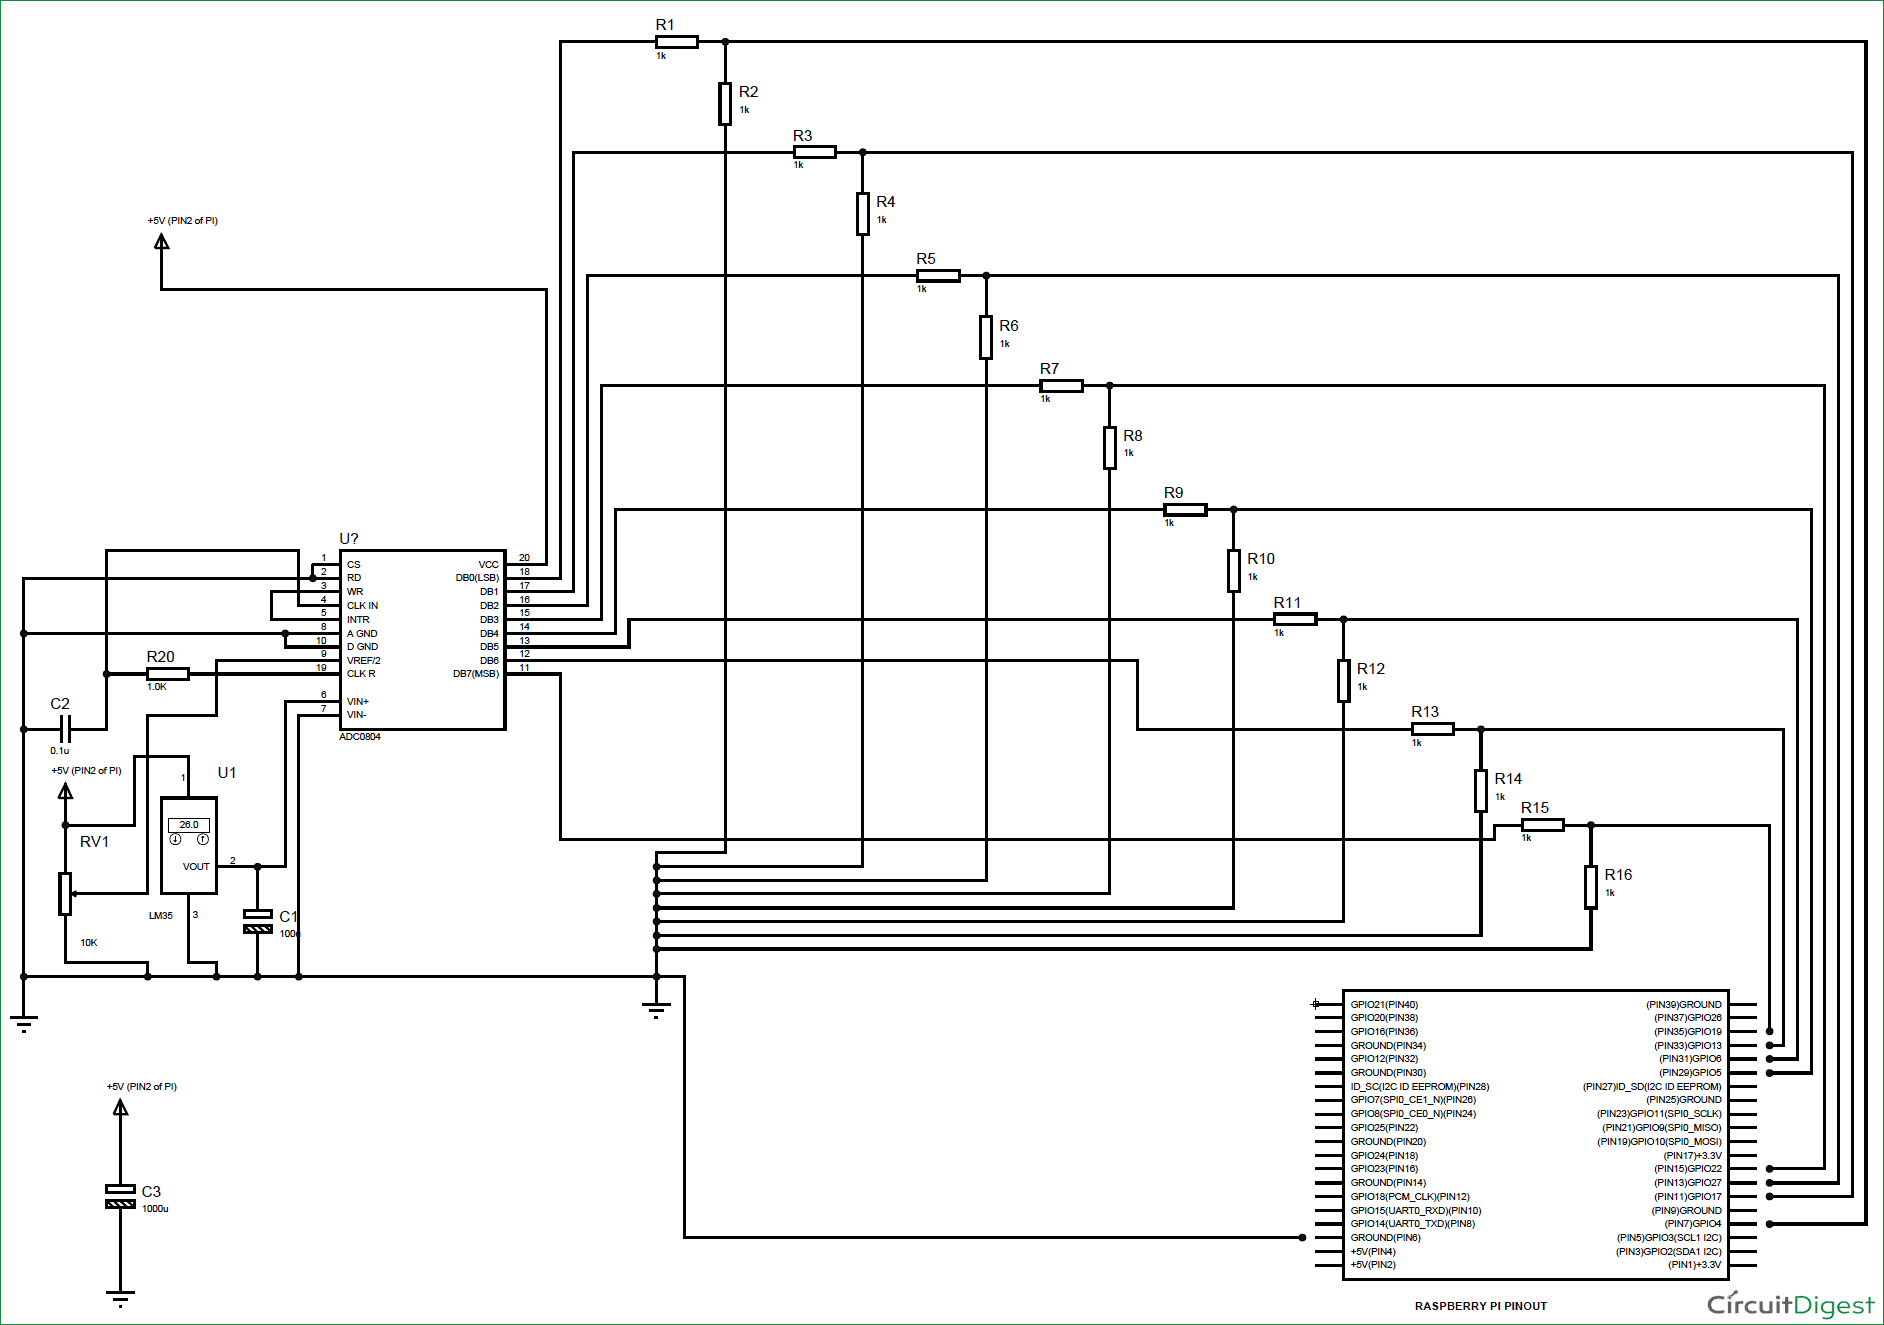
- FULL CIRCUIT:
- ADC0804 Pin-out:
- LM35 – Pin Out:
- Connection Tables:
- ADC0804 and Pi3 Connections
- LM35 Connections:
- Potentiometer Connections:
- Circuit
- Integrating with plotly:
- Step 1: Go to www.plot.ly and create a new plotly account. After that go to https://plot.ly/settings/api and create atleast two new streaming tokens. Make a note of your username, API key, streaming tokens.
- Step 2: Next, install the required modules and dependencies (you can copy and paste this in your terminal):
- Step 3: Create a new folder for your project. Create a config.json file in the said folder using a text editor and input your plotly API key, and your plotly streaming tokens.
- Code for tmp.py:
- Checking real time plotting:
- Output:
- SensorValues-Screenshot-1
- SensorValues Screenshot-2
- Plot.ly screen Capture


| S.NO | PI3 | ADC0804 |
|---|---|---|
| 1 | Pin02 - +5V | Pin20 –VCC |
| 2 | Pin06 – GND | Pin 1 –CS Pin 2- RD Pin 8 – AGND Pin 9 – DGND Pin 4 – CLKIN via 0.1uF Pin 19 – CLKR via 1k resistor and 0.1uF respectively Pin07 – V- |
| 3 | Pin07 – GPIO4 | Pin 18 – DB0 via Voltage Divider |
| 4 | Pin11 – GPIO 17 | Pin 18 – DB0 via Voltage Divider |
| 5 | Pin13 – GPIO27 | Pin 18 – DB0 via Voltage Divider |
| 6 | Pin15 – GPIO22 | Pin 18 – DB0 via Voltage Divider |
| 7 | Pin29 – GPIO5 | Pin 18 – DB0 via Voltage Divider |
| 8 | Pin31 – GPIO6 | Pin 18 – DB0 via Voltage Divider |
| 9 | Pin33 – GPIO13 | Pin 18 – DB0 via Voltage Divider |
| 10 | Pin35 –GPIO 19 | Pin 18 – DB0 via Voltage Divider |
| 11 | - | Pin 3 WR to Pin 5 INTR |
| S.NO | LM35 Pin | CONNECTION |
|---|---|---|
| 1 | Pin01 – VCC | Pin02 of Pi3 - +5V |
| 2 | Pin02 – SIGNAL | PIN06 of ADC0804 – V+ PIN06 of PI3 – GND via 100uF |
| 3 | Pin03 – GND | PIN 06 of PI3 – GND |
| S.NO | Potentiometer Pin | CONNECTION |
|---|---|---|
| 1 | Pin01 – VCC | Pin02 of Pi3 - +5V |
| 2 | Pin02 – SIGNAL – SET To 1V by Multimeter | PIN09 of ADC0804 – Vref/2 |
| 3 | Pin03 – GND | PIN 06 of PI3 – GND |

sudo apt-get install python-dev
wget https://bitbucket.org/pypa/setuptools/raw/bootstrap/ez_setup.py -O - | sudo python
sudo easy_install -U distribute
sudo apt-get install python-pip
sudo pip install rpi.gpio
sudo pip install plotlyExample config.json content:
{
"plotly_streaming_tokens": ["your_stream_token", "another_stream_token"],
"plotly_api_key": "abcdefghij",
"plotly_username": "ABCDEFGH"
}
Now Create a tmp.py file in the same folder to read temperature values and integrate them to plotly.
import plotly.plotly as py
import json
import time
import datetime
import RPi.GPIO as IO            # calling for header file which helps us use GPIO’s of PI
import sys
IO.setwarnings(False)            # do not show any warnings

with open('./config.json') as config_file:
    plotly_user_config = json.load(config_file)

py.sign_in(plotly_user_config["plotly_username"], plotly_user_config["plotly_api_key"])

url = py.plot([
    {
        'x': [], 'y': [], 'type': 'scatter',
        'stream': {
            'token': plotly_user_config['plotly_streaming_tokens'][0],
            'maxpoints': 200
        }
    }], filename='Raspberry Pi Streaming Example Values')

print "View your streaming graph here: ", url

stream = py.Stream(plotly_user_config['plotly_streaming_tokens'][0])
stream.open()

#the main sensor reading and plotting loop

x=1
b0 =0                                       # integer for storing the delay multiple
b1 =0
b2 =0
b3 =0
b4 =0
b5 =0
b6 =0
b7 =0
IO.setmode (IO.BCM)                # programming the GPIO by BCM pin numbers. (like PIN29 as‘GPIO5’)
IO.setup(4,IO.IN)                        # initialize GPIO Pins as input
IO.setup(17,IO.IN)
IO.setup(27,IO.IN)
IO.setup(22,IO.IN)
IO.setup(5,IO.IN)
IO.setup(6,IO.IN)
IO.setup(13,IO.IN)
IO.setup(19,IO.IN)
while 1:                                              # execute loop forever
    if (IO.input(19) == True):
        time.sleep(0.001)
        if (IO.input(19) == True):
            b7=1                                     # if pin19 is high bit7 is true
    if (IO.input(13) == True):
        time.sleep(0.001)
        if (IO.input(13) == True):
            b6=1                                     # if pin13 is high bit6 is true
    if (IO.input(6) == True):
        time.sleep(0.001)
        if (IO.input(6) == True):
            b5=1                                    # if pin6 is high bit5 is true
    if (IO.input(5) == True):
        time.sleep(0.001)
        if (IO.input(5) == True):
            b4=1                                   # if pin5 is high bit4 is true
    if (IO.input(22) == True):
        time.sleep(0.001)
        if (IO.input(22) == True):
            b3=1                                  # if pin22 is high bit3 is true
    if (IO.input(27) == True):
        time.sleep(0.001)
        if (IO.input(27) == True):
            b2=1                                 # if pin27 is high bit2 is true
    if (IO.input(17) == True):
        time.sleep(0.001)
        if (IO.input(17) == True):
            b1=1                                  # if pin17 is high bit1 is true
    if (IO.input(4) == True):
        time.sleep(0.001)
        if (IO.input(4) == True):
            b0=1                                      # if pin4 is high bit0 is true

    x = (1*b0)+(2*b1)                        # representing the bit values from LSB to MSB
    x = x+(4*b2)+(8*b3)
    x = x+(16*b4)+(32*b5)
    x = x+(64*b6)+(128*b7)
    x = x/1.275
    temp_C = x
    # convert celsius to fahrenheit
    temp_F = (x * 9.0 / 5.0) + 32
    # remove decimal point from millivolts
    # show only one decimal place for temprature and voltage readings
    temp_C = "%.1f" % temp_C
    temp_F = "%.1f" % temp_F


    #print the ADC value
    print(temp_C)
    # write the data to plotly
    stream.write({'x': datetime.datetime.now(), 'y': temp_C})

    # delay between stream posts
    time.sleep(0.50)


    #temp=100,ref=2000mv,read=255/200=1.275countper10mv or 1.275count for 1degree


    b0=b1=b2=b3=b4=b5=b6=b7=0      # reset the values
    time.sleep(0.50)
Run the python code in shell and visit www.plot.ly/~yourusername/0/ to see your data being plotted live. In case of above example, the URL to check would be www.plot.ly/~Karth195/0/
Vary the temperature detected by LM35 sensor by holding a match or lighter to it and see the sensor values on your Pi-3 screen as well as the data being plotted on plotly!


